A hands-on experiment where I used AI and vibe coding to automate my personal cash flow statement— revealing what the future of finance automation could look like.
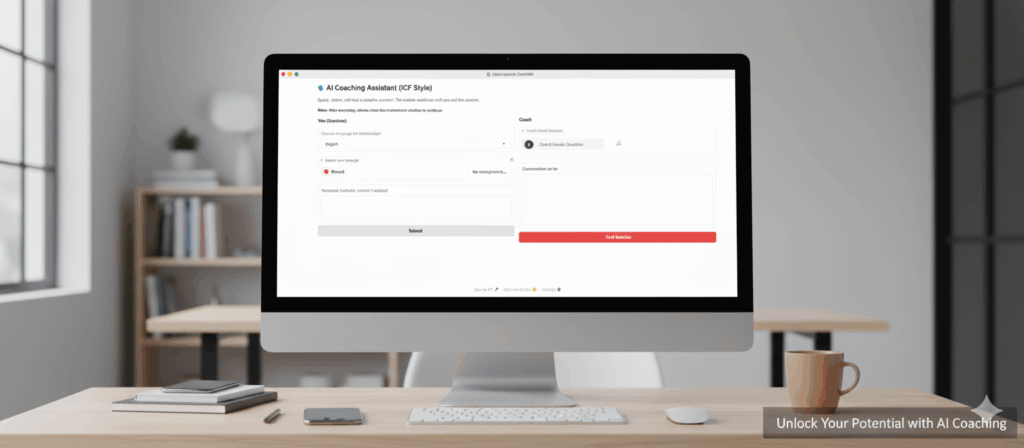
In my previous blog, How I Built a Voice-Enabled AI Coach without coding, I shared how experimenting with generative AI helped me create a digital prototype that could listen, reflect, and respond like a coach. In this blog, I will share my experience automating my income and expense tracking using AI.
As a finance professional, I’ve seen automation evolve from macros and RPA to enterprise tools. But I’ve also seen how many valuable ideas never made it past the approval committee, because the cost-benefit equation didn’t justify small automations.
After taking a career break, I began manually tracking my finances each month, a simple way to stay disciplined and understand my spending patterns. When tools like ChatGPT emerged, I decided to bring that process to life through vibe coding, an AI-assisted approach to software development that allows you to describe what you want and let the AI handle the coding.
The Early Experiments: Learning to Vibe Code
My first experiments were small but addictive. I wanted to understand how far AI could help me code and automate everyday finance tasks:
Data Extraction (Gpay) and Input consolidation (Bank Statements):
HTML and PDF statements were converted into structured Excel files, my first real encounter with unstructured data. The process revealed valuable insights into spending patterns and income sources, and it felt empowering!
Finance dashboard:
An interactive dashboard was built using Streamlit to visualize spending trends, inflows, and balances. It later evolved to support multi-year trial balance uploads for small enterprises, enabling year-on-year trend analysis, expense head comparisons, and dynamic income–expense insights.
Investment and market analysis automation:
Stock research was automated by web scraping data for Nifty 50 companies, integrating broker recommendations, and using AI to generate custom scanners on Chartlink.
Each mini project built confidence and taught me something new: data cleaning, logic building, prompt precision, and the joy of seeing results appear instantly.
The Turning Point: Building a Complete Automation
After nearly a year of these experiments, I realized I had something valuable — three years of my own expense data, neatly structured and rich in patterns.
It felt like the perfect dataset to test a bigger ambition:
To build a fully automated cash flow system, end to end, from bank statement extraction to forecasting.
The Architecture of cash flow automation
")
Step 1: Unifying the Raw Data
I started with multiple bank statements with different file type (PDF/Excel) and formats. The challenges mirrored what every finance team faces:
- Non-standardized formats of the statements
- Inconsistent debit/credit representations
- Ambiguous or truncated transaction descriptions
- Date formats that refused to align
Step 2: Building the Rule-Based Categorization Engine
Once data was standardized, the next step was to build a rules-based categorization engine:
- Used regex and keyword mapping to assign categories (e.g., “Zomato” → Food & Groceries, “Int Recd” → Interest Income)
- Added priority logic to handle overlaps (“Wellness” could be Health related or it could also be Salon & Spa)
- Created exception rules to override defaults
Step 3: Predicting Classification with Machine Learning
When the rules hit their limit, I added machine learning (TF-IDF + Logistic Regression) trained on 3 years of historical data.
By training on the past data, the model could predict how new transactions might be classified. A confidence threshold of 65% ensured low-certainty predictions were reviewed manually.
Step 4: Forecasting with a Financial Model
The next step was to use this Cash Flow Statement to forecast my fund position for the next 25 years.
The model incorporated variables such as investment corpus, asset allocation across equity, debt, and cash across different timelines (for e.g. aggressive allocation strategy until 60 years) , expected annual returns for each asset class, inflation rates, and planned withdrawals.
These inputs feed into a calculation sheet that automatically generates year-by-year projections. Any adjustments to the input sheet would adjust the portfolio balance, returns, and rebalancing logic in real time.
While this model was built using rule-based financial formulas, it lays the groundwork for a future version powered by machine learning.
Step 5 (The LLM Vision): Creating a Conversational Interface
This final layer is a conversational interface. Built on Python and Streamlit, the app allows users to upload Excel or CSV files and describe, in plain language, what the data is and what they want to see — “Cash Flow Statement for FY 21–24 — show income trends and top cost heads.”
The system connects directly to ChatGPT, which acts as the reasoning engine:
Together, these layers formed a complete automation journey — from raw data to intelligent conversation. But beyond the code and dashboards, what truly stood out was how accessible automation becomes when AI enters the picture.
Automation at scale starts with the confidence to automate something small.
Finance leaders who encourage experimentation, invest in basic AI literacy, and shift from ROI-driven approval cycles to learning-driven exploration will build faster, more adaptive teams.
Finance leadership in the AI era is about curiosity, logic, and the courage to experiment. What excites me most is how accessible this has become — if you understand your data and can think in workflows, AI can now handle the heavy lifting.
AI is transforming both the how and the who of automation — it’s redefining who builds it.